Unpacking the Black Box: Facilitating Visual Inspection of Large Datasets by Means of Interactive Web-Based Visualizations
During the past decade, big data has become a major tool in scientific endeavours. While statistical methods and algorithms are well-suited for analysing and summarizing enormous amounts of data, the results do not allow for a visual inspection of the entire data. Current scientific software, including R packages and Python libraries, do not support interactive visualizations of large datasets. However, recent hardware developments, especially advancements in low energy graphical processing units (GPUs), allow for the rendering of millions of data points on a wide range of consumer hardware like laptops, tablets and mobile phones. Similar to the challenges and opportunities brought to virtually every scientific field by big data1, both the visualization of and interaction with copious amounts of data is both demanding and holds great promise.
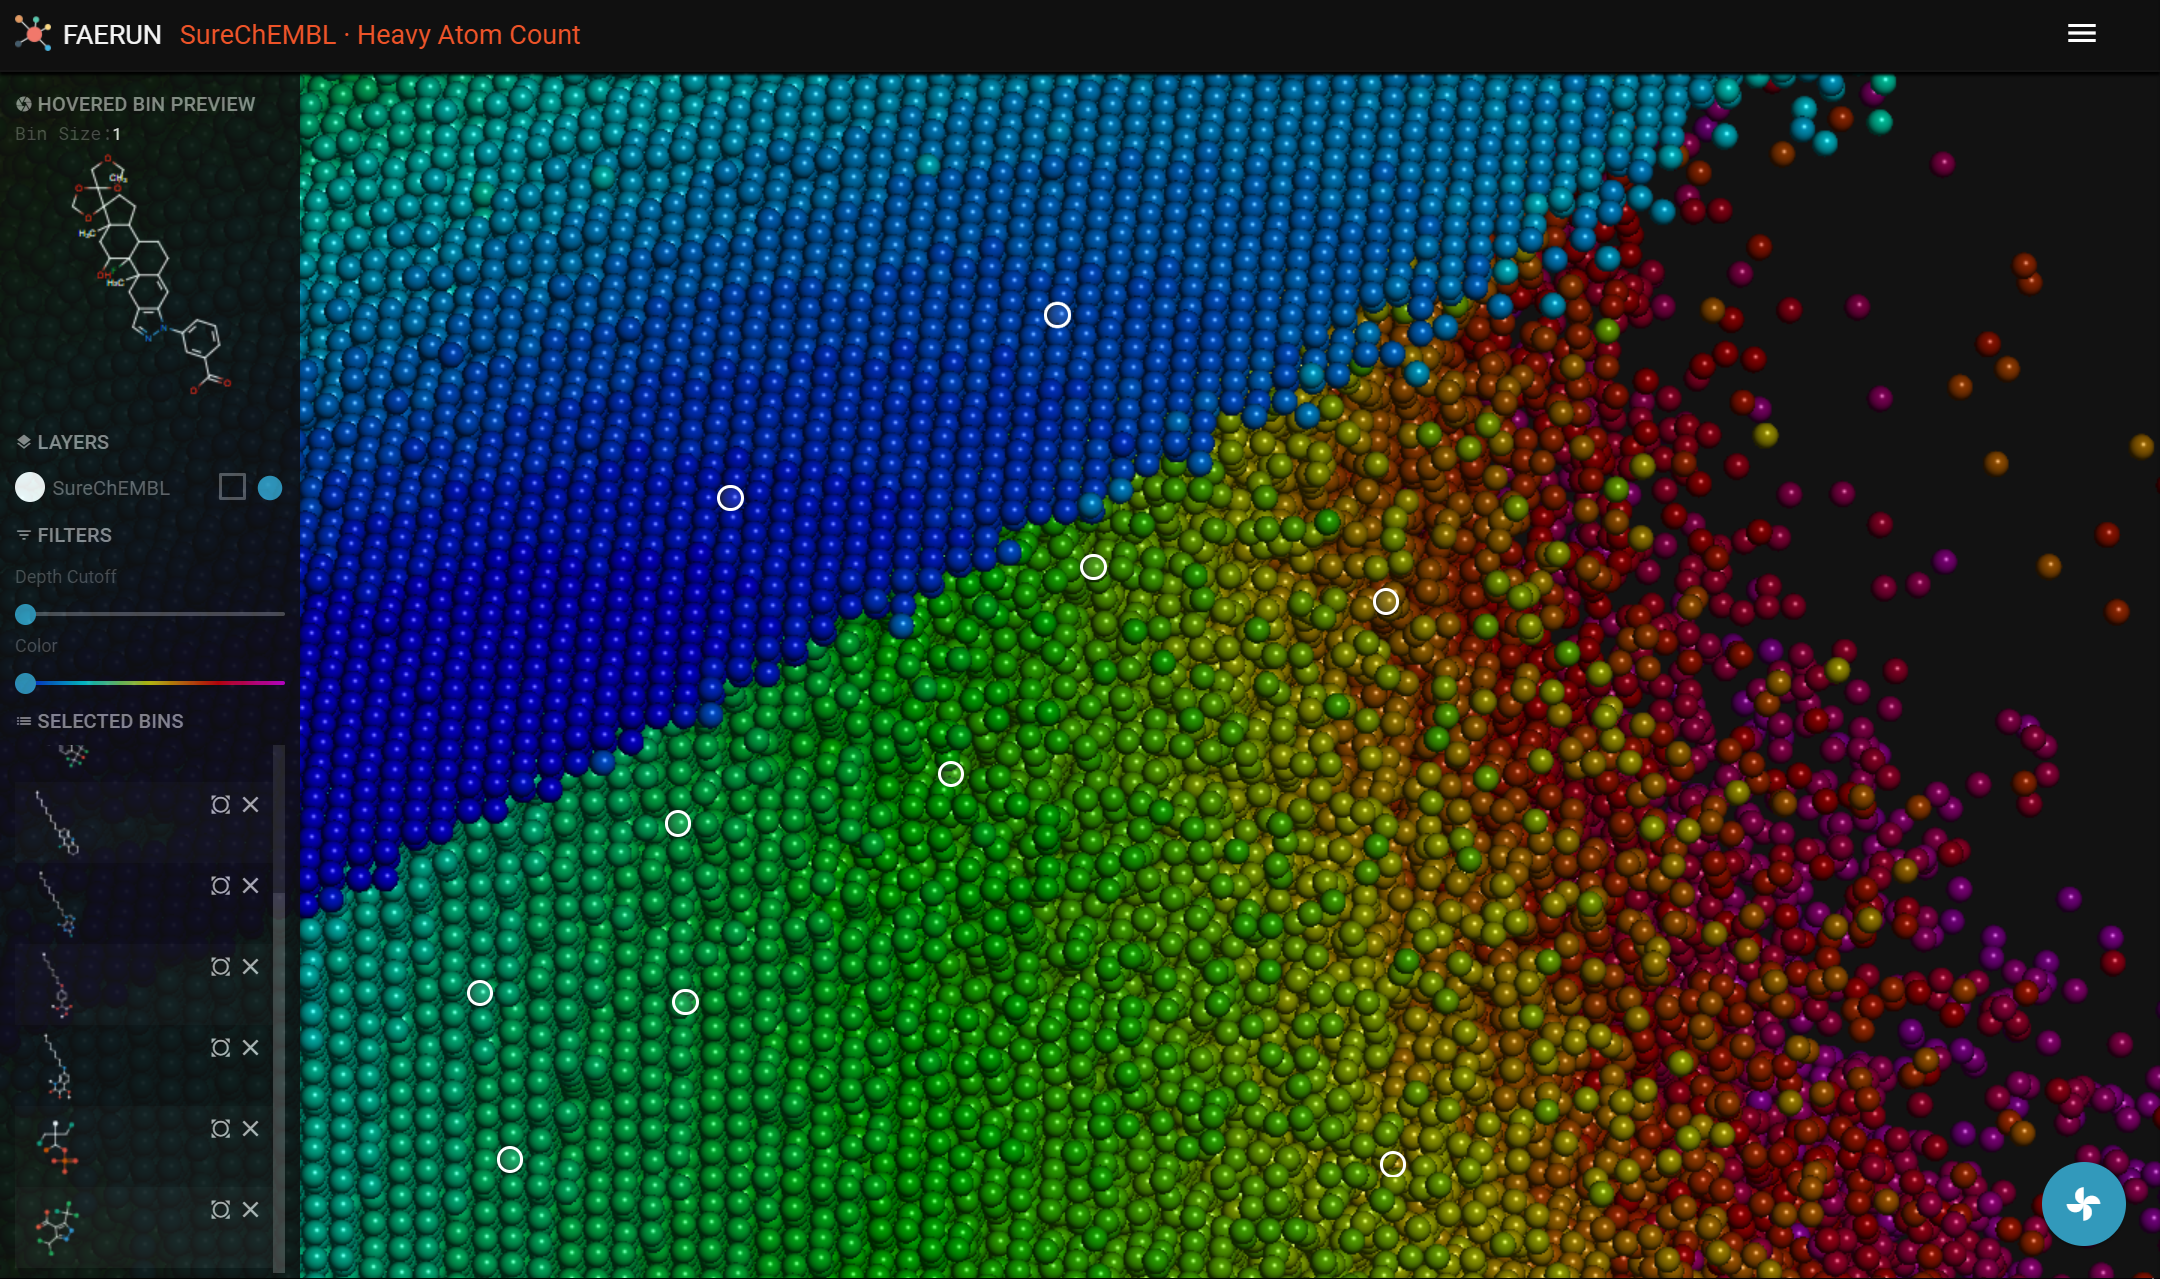
Building on the Java-based mapplets our group has published in the past2, we work on furthering the concept of interactively exploring chemical data in spatial representations as a complement to searching the data, which is often the only way to access databases such as ChEMBL, SureChEMBL or even relatively small data sets such as Drugbank. Given recent developments in web technology and broadband infrastructure, we focus our work on web-based applications3,4.
[1] Igor V. Tetko, Ola Engkvist, Uwe Koch, Jean-Louis Reymond, Hongming Chen Analysis in Chemistry. Mol. Inf., 2016, 35, p 615.
[2] M. Awale, R. van Deursen, J.-L. Reymond, J. Chem. Inf. Model. 2013, 53, pp 509-518.
[3] Mahendra Awale, and Jean-Louis Reymond, J. Chem. Inf. Model., 2016, 8 (1), p 25.
[4] Awale, Mahendra, Daniel Probst, and Jean-Louis Reymond. J. Chem. Inf. Model, 2017, 57 (4), pp 643–649.